North Coast Hwy Pulse
Weekly Corridor Report
2026-04-25 — 2026-05-02
5,658
Total Events
5,396
Vehicles
cars + trucks
260
Pedestrians
4.6% of corridor
Emerging
Walkability Signal
by pedestrian share
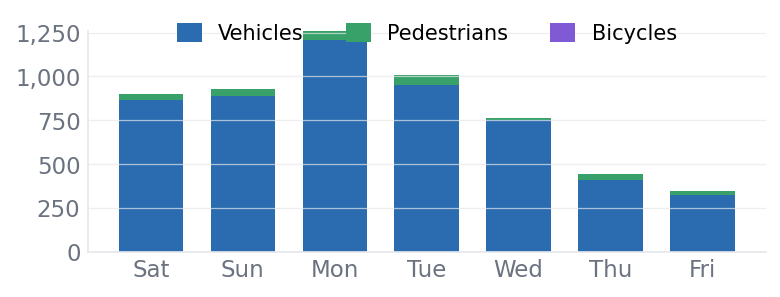
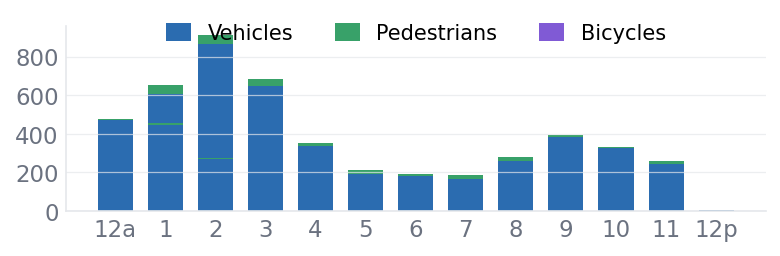
The corridor recorded 5,658 total events for the period, with vehicle traffic remaining the dominant activity. Peak activity occurred between 13:00 and 15:00, where both vehicle and pedestrian volumes reached their highest levels. The pedestrian share of 4.6% suggests a burgeoning movement toward walkability, though the volume remains secondary to automotive flow.
Cross-validated estimate
methodology v1
289
vehicles ± 35%
Reconciled across 11 hour(s):
0 high ·
0 medium ·
11 low
Components: line-crossing count = 289 · scene-occupancy estimate = 0
Daily Activity
Hourly Pattern
Best Business Windows
Peak Pedestrian Exposure
13:00
47 pedestrians/wk
Peak Vehicle Exposure
14:00
867 vehicles/wk
Directional Split
Downtown ↑
↓ Harbor
Top Downtown-Bound Hours
| Hour | Count |
|---|---|
| 07:00 | 395 |
| 06:00 | 305 |
| 08:00 | 284 |
Top Harbor-Bound Hours
| Hour | Count |
|---|---|
| 07:00 | 472 |
| 08:00 | 367 |
| 17:00 | 321 |
Peak Windows
Top Pedestrian Hours
| Hour | Count |
|---|---|
| 13:00 | 47 |
| 14:00 | 45 |
| 15:00 | 34 |
| 20:00 | 23 |
| 17:00 | 21 |
Top Vehicle Hours
| Hour | Count |
|---|---|
| 14:00 | 867 |
| 15:00 | 650 |
| 13:00 | 604 |
| 00:00 | 472 |
| 01:00 | 445 |
Weekday vs Weekend Averages
Weekday (Mon-Fri)
| Class | Avg/Day |
|---|---|
| bicycle | 0 |
| bus | 3 |
| car | 725 |
| person | 36 |
| truck | 0 |
Weekend (Sat-Sun)
| Class | Avg/Day |
|---|---|
| bicycle | 0 |
| bus | 2 |
| car | 872 |
| person | 39 |
| truck | 1 |
Classification Breakdown
| Class | Total Count |
|---|---|
| bicycle | 2 |
| bus | 21 |
| car | 5370 |
| person | 260 |
| truck | 5 |
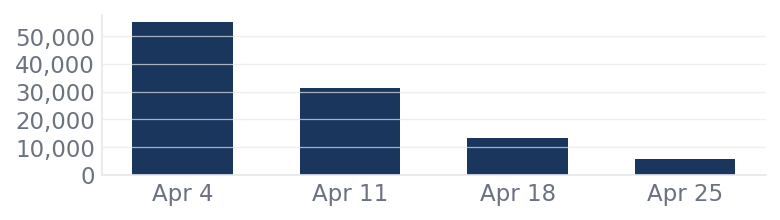
Pilot Collection Trend -55.6%
Walkability Insights
Pedestrian activity peaked at 13:00 with 47 persons, indicating a midday concentration of foot traffic consistent with shopping and dining hours. The current pedestrian-to-vehicle ratio suggests that most visitors continue to access the corridor via car, which may indicate an opportunity for further walkability enhancements to support local businesses.