**North Coast Hwy Buzz | Traffic Analytics Report**
**Period:** 2026-05-01 to 2026-05-08
**1. Geometry/Zone Summary**
The monitoring system is active across 6 configured counting zones. Data indicates a significant volume disparity between weekends and weekdays, with Saturday exhibiting substantially higher multimodal activity (cars, pedestrians, and cyclists) compared to Friday.
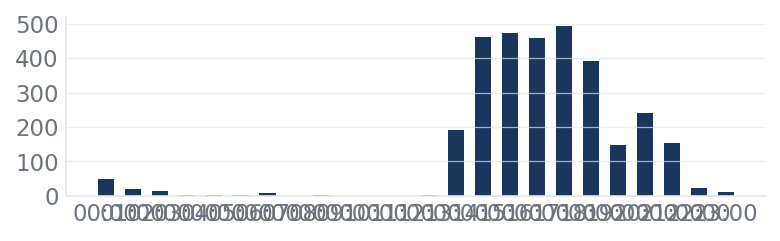
**2. Optimal Operating Windows**
* **Peak Foot Traffic:** 17:00 – 18:00 (Highest pedestrian density)
* **Peak Delivery/Vehicle Access:** 14:00 – 16:00 (Highest vehicle volume)
* **Overall Peak Activity:** 17:00 (Highest total traffic combined)
**3. Business Recommendations**
* **Staffing & Sales:** Increase retail staffing and front-of-house presence between 17:00 and 18:00 to capitalize on the peak pedestrian window.
* **Logistics:** Schedule heavy deliveries and stock replenishment between 13:00 and 16:00 to align with the highest vehicle flow periods.
* **Marketing/Events:** Focus promotional activities and outdoor activations on Saturdays, as they drive significantly more traffic than Fridays.